
Our Methodology
The Voter Impact Index is based on the notion that the impact of an additional vote will be greatest in areas where recent election results have been closest. Therefore, we created metrics of closeness of races for different offices that can be combined into a single Impact score.
The analytic output for the Voter Impact Index has four steps:
1. Measure the closeness of recent elections for the six targeted office types
2. Assign a general election race for each of the six office types to every ZIP code
3. Assign a relative weight for the metric for each targeted office type, for purposes of calculating a single, combined metric
4. Combine the metrics for each of the six elections assigned to a ZIP code into a single overall metric, based on assigned weightings
Transform source data into "general election race" tables
We start with recent election results for each of the six targeted office types. In total, 8,022 recent races were held to fill the six targeted office types. For each race, we add fields for (1) the absolute vote difference between the race's winner and the next closest candidate from another party, and (2) the percent point difference between those two candidates.
Identify uncontested races
We define an "uncontested" election as a race where (a) the general election was cancelled, (b) one candidate had a margin of victory greater than 80 percent, or (c) multiple candidates from the same party had a margin of victory greater than 90 percent. Of the 8,022 races which were held to fill the six targeted office types, 2,744 were uncontested. These were primarily in state legislative races.
Develop standardized metric of closeness of contested races
The percentage gap calculated for each race was the starting point for a race closeness metric. However, what constitutes a close race may vary across the six different office types being tracked. Therefore, z-scores were used to create a standardized metric across all six office types. The z-score requires two calculations based on each of the six office type datasets: (a) the average percent point gap for all races for each type of office, and (b) the standard deviation of the gaps for all races for each type of office. These z-score calculations yielded results across all six office types within a range from -2 (most competitive races) to +3 (least competitive races), with an average z-score = 0. In addition, all uncontested races were assigned a z-score of +3 (least competitive).
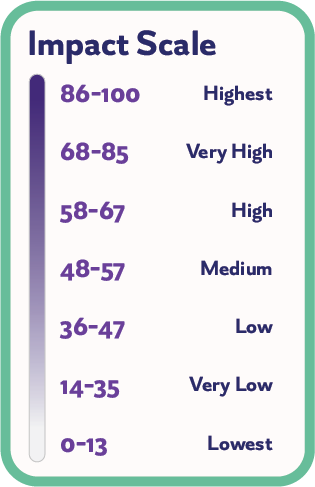
These z-scores were converted to a Impact score from 0 to 100 using the following formulas (coming soon):
- if z-score < 0, index = 50 + ( |z-score| / 2) * 50
- if z-score > 0, index = 50 - ( |z-score| / 3) * 50
- in z-score = 0, index = 50
Collapse instances where one election jurisdiction has multiple races
Some geographic areas have multiple officials holding the same office. For example, each state has two US senators. In addition, some states have election districts that elect multiple state senators/representatives. In instances where that occurs, the average of all races was calculated (i.e., for the US Senate, we average the results for both of that state's US senators).
Assign a weight to each type of election within each jurisdiction
We created an algorithm that can apply different weightings to each office type across all jurisdictions. Our base algorithm reflects the PowerMoves point of view about the relative importance of each election for purposes of calculating a single, combined metric. We also have a version that does not include the presidential election since there is no presidential race in 2026.
Note: Important assumptions with respect to our methodology:
Recent election outcomes are indicative of future competitiveness but clearly other factors also contribute
A 'close' election is defined by the extent to which the (absolute) percentage vote margin deviates from the mean